Measuring What Matters: An Alternative Wellbeing Framework for a Fairer Future

Each year, the Government of Ireland publishes a wellbeing report, Understanding Life in Ireland, to assess the quality of life across economic, social, and environmental domains. This framework plays an increasingly important role in policymaking, including its use in the Budgetary process and in shaping discussions during the National Economic Dialogue, the Summer Economic Statement, and Budget Day documentation. It is essential to critically assess both the evolving priorities within the framework as well as how comprehensively it represents the wellbeing of all segments of the population. However, the Government’s 2024 wellbeing report presents a limited perspective, focusing on aggregate trends while removing equality and sustainability from its core measurement approach (elements that had been included in the 2023 edition). While these issues are acknowledged in the narrative, their absence from core metrics makes it difficult to assess who is benefitting from progress and whether the gains are sustainable in the long term.
Here, Social Justice Ireland presents its alternative wellbeing framework, offering a more inclusive and equitable approach to measuring progress. By integrating a broader range of meaningful indicators, it provides a more accurate and actionable picture of wellbeing in Ireland – one that places greater emphasis on those most at risk of being left behind. To explore the selection of indicators and understand how they were chosen, and read the full analysis, check out our report Wellbeing: Measuring What Matters.
Key Findings from the Alternative Wellbeing Framework
Performance: Out of the eleven dimensions, four show modest improvements, while two dimensions – Mental and Physical Health and Civic Engagement, Trust and Cultural Expression – show negligible progress. However, five dimensions – Subjective Wellbeing; Housing and Built Environment; Environment, Climate and Biodiversity; Safety and Security; and Time Use – show negative performance, indicating deterioration over time.
Equality1: Disparities persist across all nine dimensions measured for equality. While three dimensions show relatively lower levels of inequality compared to others, four dimensions reflect almost 100 per cent disparity. Two dimensions – Housing and Built Environment and Work and Job Quality – show worsening divides, highlighting a deepening gap between different groups.
Sustainability: Progress in sustainability is marginal across the six dimensions tagged for sustainability. Alarmingly, Environment, Climate and Biodiversity demonstrates a concerning decline, highlighting ongoing challenges in meeting emissions reduction targets and energy affordability concerns.
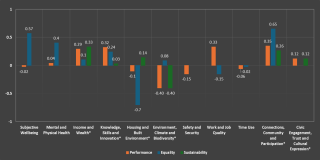
Note: (*) indicates that the dimensions that have sustainability indicators.
What do these findings tell us?
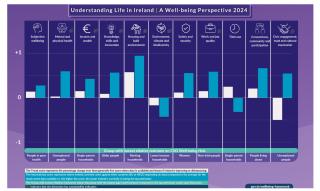
The results of Social Justice Ireland’s alternative wellbeing framework (Figure 1) paint a troubling picture of societal wellbeing. While some areas show modest improvements, substantial disparities persist, and progress in key dimensions remains fragile and uneven. In particular, the lack of focus on equality and sustainability in the Government’s Wellbeing Framework (Figure 2) risks presenting an overly optimistic picture that does not accurately reflect the lived realities of many.
GIVING A VOICE TO THOSE
WHO DON’T HAVE A VOICE
When you support Social Justice Ireland, you are tackling the causes of problems.
Why We Need a New Approach to Wellbeing
While both frameworks aim to measure wellbeing across multiple dimensions, they differ significantly in the choice of indicators, scoring trends, and focus areas, which ultimately present two distinct realities of life in Ireland. Across dimensions, Social Justice Ireland’s alternative framework (Figure 1) consistently reveals persistent inequalities that are not visible in the Government’s Framework (Figure 2). The Government’s Wellbeing Framework tends to focus on aggregate progress and international comparisons, which can mask the lived experiences of vulnerable populations. In contrast, this alternative wellbeing report focuses on equity, inclusivity, and sustainability, ensuring that no one is left behind. Equality scores across dimensions reflect widening disparities in housing, income, healthcare, and access to public services. Vulnerable groups – including renters, single-parent households, those unable to work due to long-term health problems, and individuals with lower education levels – continue to experience disproportionate challenges, hindering inclusive wellbeing. Addressing these issues through sustainable investments, equitable policies, and improved data collection will be essential to ensure inclusive and resilient progress for all.
Towards a Fairer Future
The key question is how to effectively improve wellbeing. This is where a comprehensive, coherent policy agenda guided by principles of fairness, sustainability, and the common good would be transformative. Social Justice Ireland proposes an integrated policy framework for a new Social Contract, identifying five key policy outcomes: Vibrant Economy, Decent Services and Infrastructure, Just Taxation, Good Governance and Sustainability. As Ireland continues to embed the Wellbeing Framework in its policymaking processes, it is essential to prioritise equity, inclusion, and long-term sustainability. By adopting a more comprehensive and nuanced approach to wellbeing measurement, policymakers can ensure that Ireland’s progress is both resilient and inclusive, paving the way for a fairer and more just society.
As a starting point, the following policy recommendations linked to the outcomes for a renewed social contract would make a significant difference in improving Ireland’s Wellbeing:
|
Vibrant Economy |
|
|
Decent Services and Infrastructure |
|
|
Just Taxation |
|
|
Good Governance |
|
|
Sustainability |
|
For greater detail on the policy recommendations, please see Social Justice Ireland’s proposal and response to the Programme for Government and our annual Socio-Economic Review.
1 A score of +1 reflects full equality, while 0 indicates a 100 per cent disparity between the best- and worst-performing groups, and a negative score represents a 200 per cent disparity (a negative score arises if the relative percentage difference exceeds 100 per cent). See the report for greater detail.