A Decade of Income Tax Cuts have Favoured the Better Off

Many of the Budgets since the end of the last economic crisis have given emphasis to providing reductions in income taxation. Some recent commentary has also attempted to suggest that income taxes are abnormally high and that some further income tax cuts are needed. However, in the context of Budget 2025 the evidence suggests otherwise.
Income taxes over time
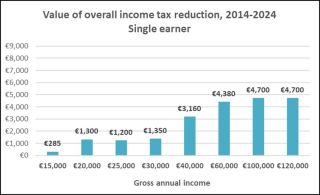
Looking back over the past few decades, data from the Department of Finance’s income tax reports, which accompany each year’s Budget, demonstrate that the proportion of gross income paid in all forms of income taxes, levies and social insurance payments fell substantially from the late 1990s to their lowest levels in 2008. These effective taxation rates increased from 2008 to 2013, returning to levels equivalent to those that existed in 2003. Rates were unchanged in 2013 and 2014. Since 2014 budgetary policy has provided recurring decreases in income taxes. Over three charts we compare the total annual value of these reductions between 2014 and 2024. The analysis captures changes to income tax rates, USC rates, social insurance rates and structures, income tax credits and bands. For example a single earner with a gross income of €40,000 paid €9,920 in income taxes, employee PRSI and USC in 2014 and pays €6,760 in 2024; a reduction of €3,160 per annum.
Value of overall income tax reduction, 2014-2024: Single earner
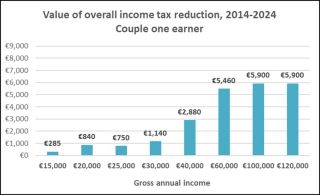
Value of overall income tax reduction, 2014-2024: Couple, one earner
Value of overall income tax reduction, 2014-2024: Couple two earners
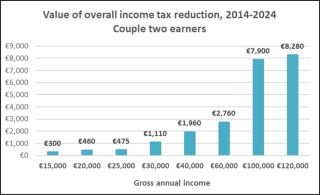
Source for Charts: Department of Finance Budget Documents - various years and Social Justice Ireland, Social Justice Matters 2024 - taxation annex. Notes: All workers are assumed to be PAYE workers. For couples with 2 earners the income is assumed to be split 65%/35%. Couples with one earner are assumed to be entitled to the Home Carer Credit.
The analysis highlights a number of points. First, it provides evidence of the scale of the income tax re-ductions delivered over recent years; these are often overlooked, yet are substantial at the individu-al/household level and at the ex-chequer level. Second, the charts illustrate the distribution of these income tax decreases. As we have frequently highlighted the gains have been skewed to higher in-come earners and households.